
Use the Search magnifying glass above to search the site. Use CNTL+F to find text on pages; Apple, use Command+F.
17 Million Miles From Yesterday
COHERENCE, Vol 1, Issue 3, March 5th, 2022, by Stephen Elliott, Editor

Updated May 21st, 2022.
Major references for this article come from NASA.gov.
In case you don’t feel like you’ve been going anywhere lately, especially in the last couple of years, here’s a different way to see, via the lens of the astronomical sciences.
Astronomy and astrophysics tell us that we’re very wrong about this, that in fact we’ve traveled millions of miles in just the last 24 hours. How can this be?
Unless one has had cause to consider it, we probably accept that the sun rises in the morning and sets in the afternoon, day after day, and that seasons change year after year, these regular periodic changes becoming well known to us early in life, after which we largely accept them for granted as the totality of what is going on planet Earth.
However, beyond the action of the Earth turning daily and circling the sun annually, there is a much larger picture, known to us only via instrumentation.
Early navigation of the open seas required more than guesswork, consequently some of the earliest instruments for examining the heavens came from inventors for purposes of navigation on the open seas including “the gnoman”, “the kamal”, “the astrolabe”, and “the sextant”, in order of technological advancement, all early inventions that helped mariners navigate based on an objective position of the sun, moon, and stars.
Today the instruments of astro-science are powerful optical telescopes, space cameras, huge radio telescopes, advanced spectral analysis capable of examining the entire spectrum of electromagnetic emissions in great detail, all this to understand the motion of the universe and our place in the universal big picture. This is all made possible by electronics, and powerful computing, relatively recent advancements in technology that have allowed us to peer further and deeper into the universe than with optical telescopes alone, which came into being several centuries before.
~
This article takes us beyond the relatively local motion of the solar system, summing the distances we travel as functions of Earth, the solar system, galactic motion (where our solar system resides in an arm of the Milky Way galaxy estimated to be 100 light years in diameter), and universal expansion, where the universe we are part of is moving ever-outwardly.
Let us begin our journey with a discussion of Earth and the distance that we travel each day with Earth’s rotation, alone.
At the equator, the Earth’s diameter is 12,738 Km (7917 miles). Consequently, if one is at the equator sitting in an arm chair, in 24 hours we would travel the full circumference of Earth, which equals πD or 3.14 x 12,738 Km, the result being 39,900 Km (24,000 Miles).
In my discussion of Coherent Breathing, I often reference the physiologic fact that the average adult body contains ~24,000 miles of blood vessels, that if laid end to end would stretch around the equator, a very interesting factoid if we think about it.
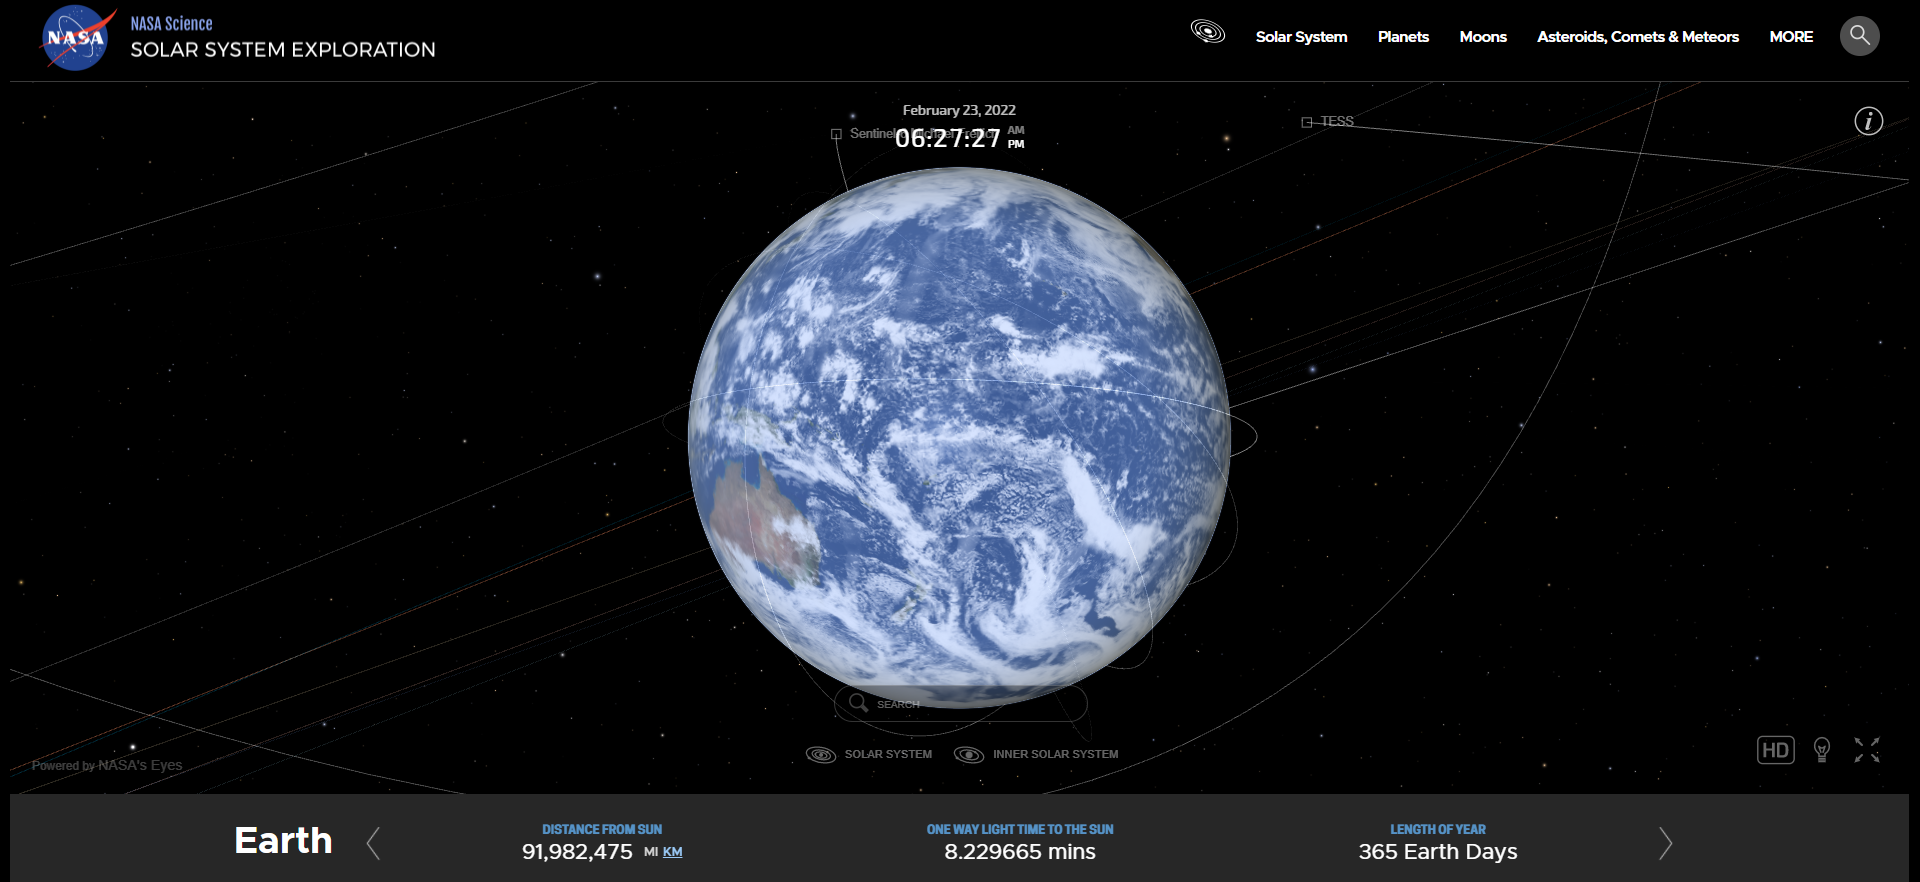
Figure 1: The Earth (Click On The Image To View Live)
So day after day we are zooming around Earth’s axis at the rate of 1,666 Km per hour (1,035 Mph). If we’re flying in a relatively fast aircraft we can add or subtract from this number, allowing us to move forward or backward in planet time, hence the phenomenon of “jet lag” relative to our own circadian rhythm.
Keeping it in perspective, commercial jets fly at 960 Km/hour (600 Mph), so they add or take away enough time to be able to feel it when landing on the other side of an ocean or continent. Personally, I have a few million airline miles under my belt, something I am not proud of relative to environmental impact, but I mention it for perspective.
~
The Earth rotates on it’s axis at the rate of 1,666 Km/hour covering the distance of ~40,000 Km/day (at the surface on the equator). However, this is the lesser of the rates at which Earth is moving and the distance it is traversing each day. The greater rate and distance is that traveled by the Earth in its annual rotation around the sun.
Earth is 1 Astronomical Unit (AU) from the sun, ~150,000,000 Km (93,000,000 miles). Assuming a circular orbit for simplicity, the circumference of the Earth’s orbit around the sun is 940,000,000 Km (584,000,000 Miles). Dividing these distances by 365, we arrive at 2,600,000 Km (1,600,000 Miles) per day.
The rotation of Earth and other planets around the Sun is depicted in Figure 2 below, NASA’s animated real-time exhibit depicting where planets and other objects in the Sun’s orbital space are in time. (Click on the graphic to view. Use the mouse wheel to zoom in and out.) Details about each planet and object are accessible by clicking on them. This takes a few seconds to load
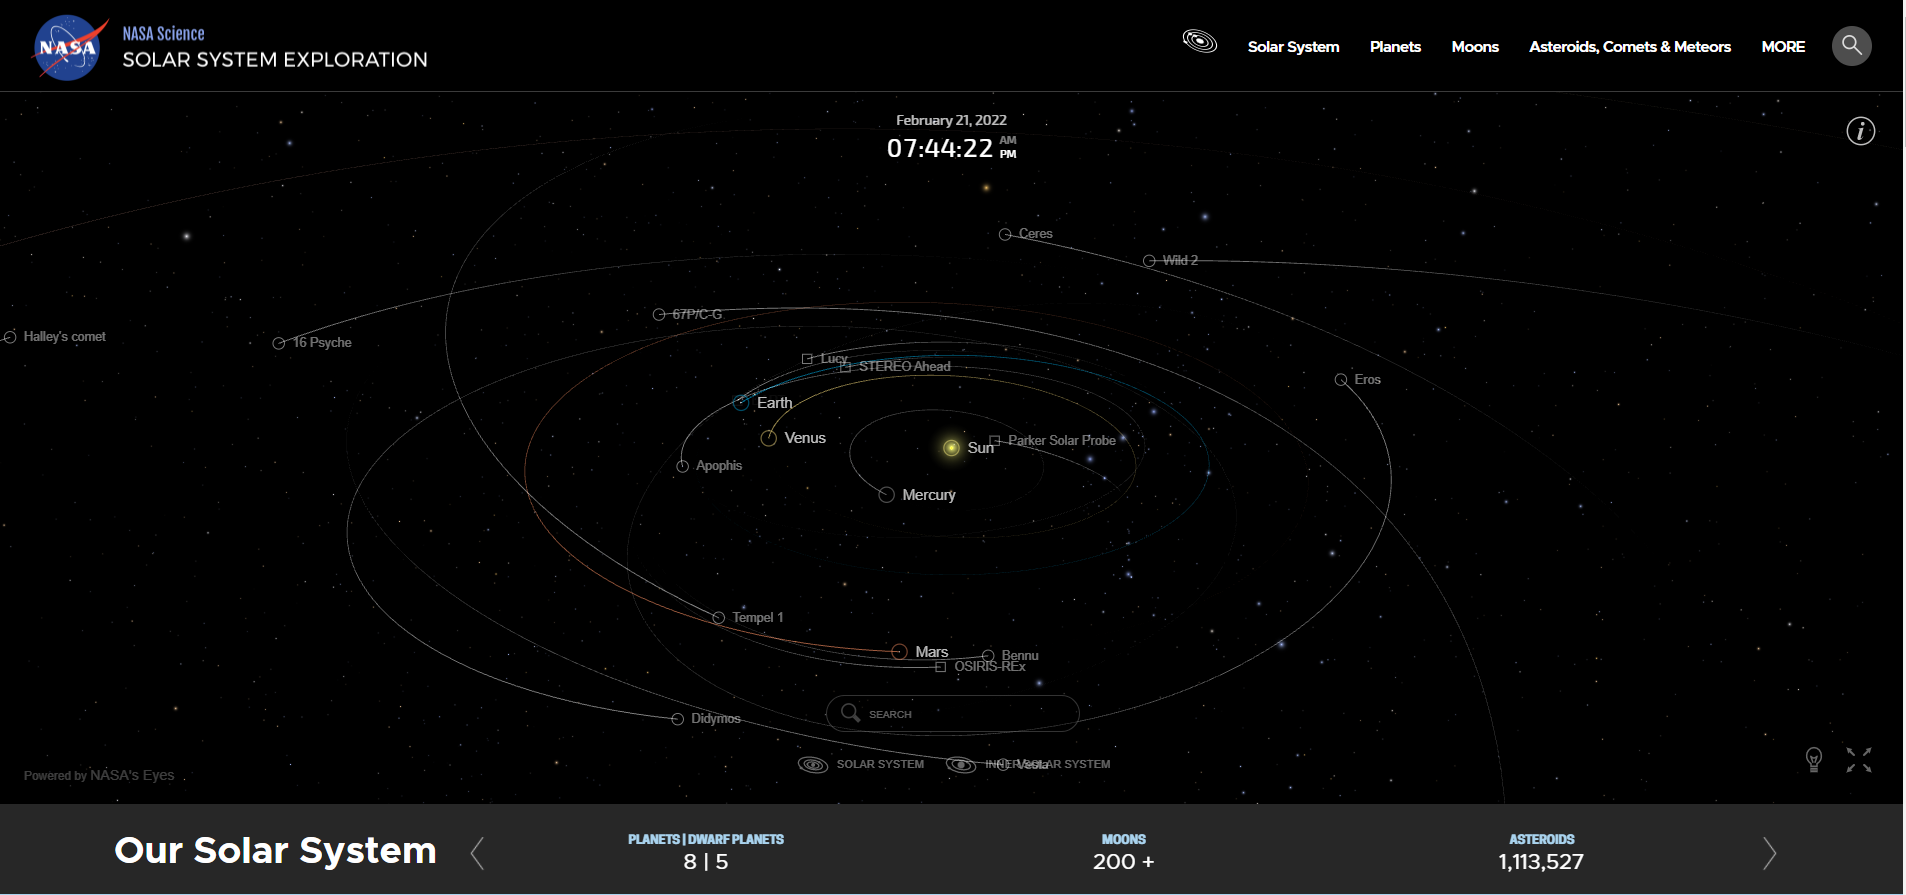
Figure 2: NASA's Solar System Exploration Live (Click On The Image To View Live)
Adding the distance resulting from rotation with that resulting from solar system orbit, we’ve now traveled nearly 2.7 million Km (1.6M Miles) in 1 day. Dividing this number by 24 hours, we get ~110,000 Km/H (~68,000 Mph).
I hope that you find this discussion entertaining because we’re about to take the big leap in time and distance…
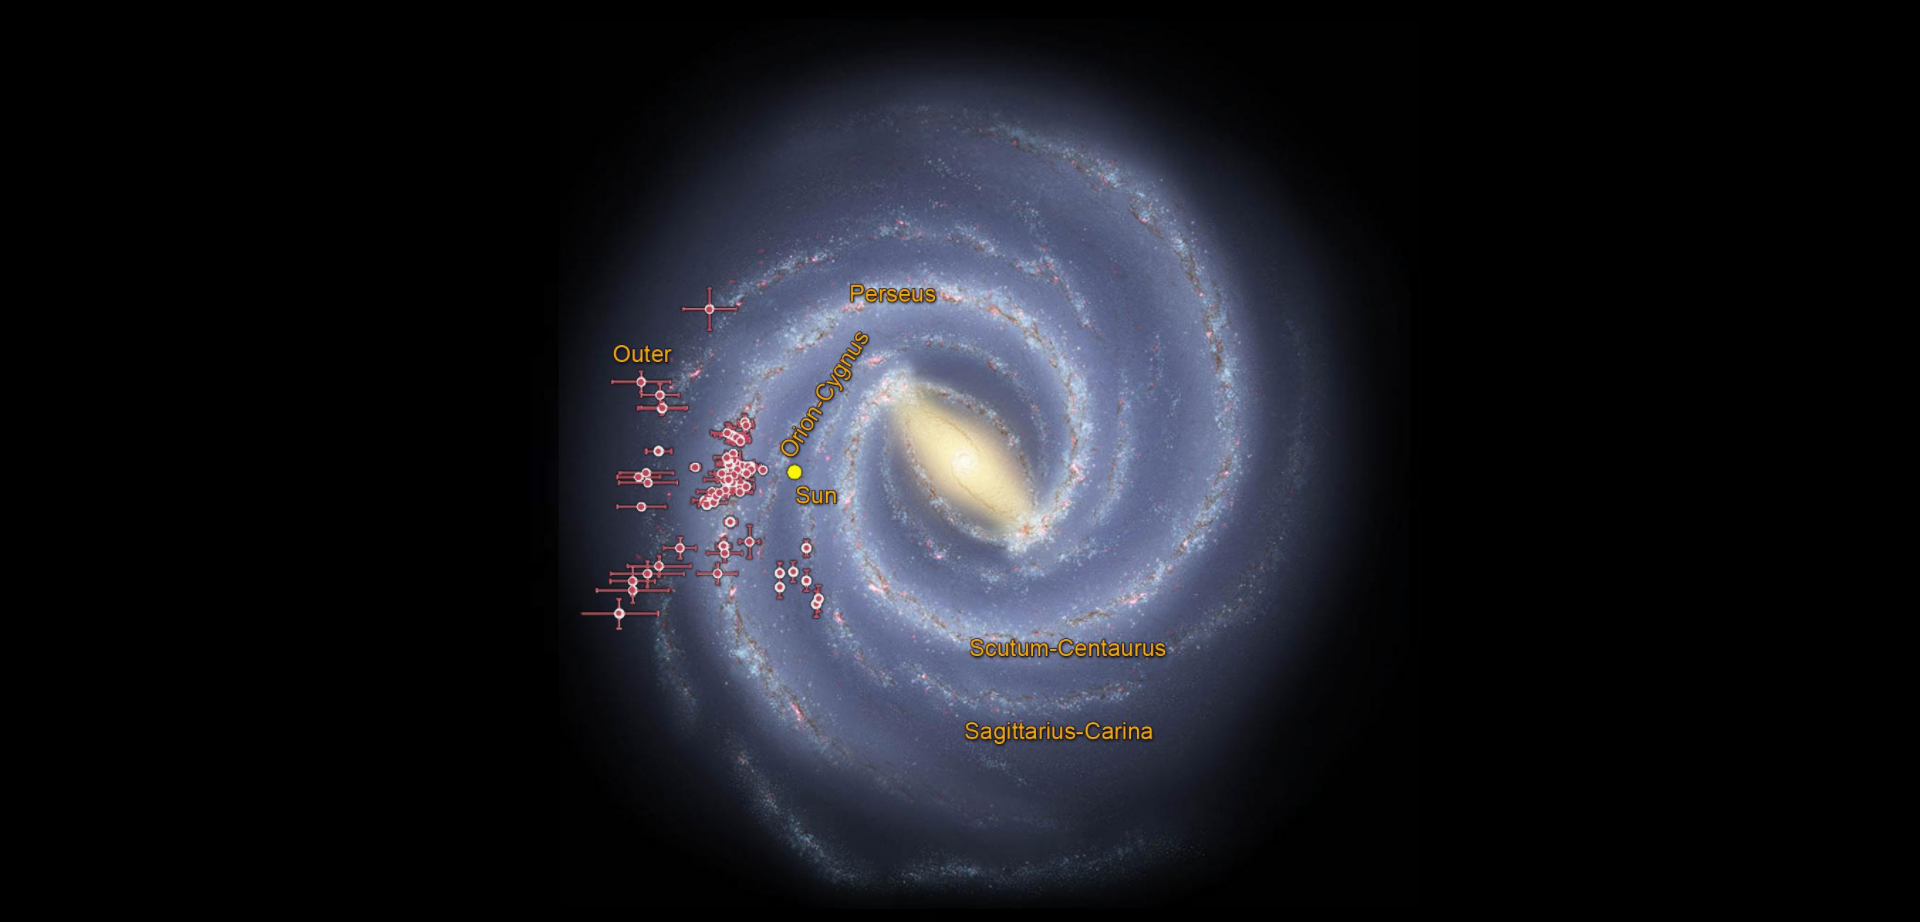
Figure 3: Our Solar System's Place In The Milky Way Galaxy (NASA - Jet Propulsion Laboratory)
Our solar system is located in one of the Milky Way’s spiral arms, that called Orion Cygnus. To discuss its position we must take the leap to the units of light years, 1 light year being ~9.5 trillion Km (~5.9 trillion Miles). Of course, a light year is the distance that light travels in 1 year.
The Milky Way is estimated to be 100,000 light years across. Figure 3 is a NASA artist’s rendering of what the Milky Way looks like based on observable data collected by telescopes, satellites, and space probes. We’re not able to look at it’s pinwheel shape directly because our solar system is in the plane of the Milky Way and it is so large that we have not been able to reach far enough away with a space camera to bring its width into view. This challenge is explained in Figure 4 below, where the question is – how far away would a space camera need to be to from the Milky Way center in order to capture its breadth.
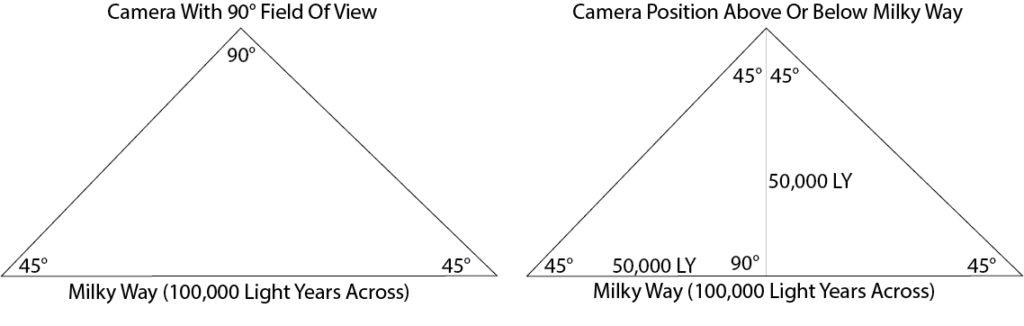
Figure 4: Distance Above Or Below Milky Way In Order To Capture Its Width
Assuming a 90 degree field of view ― the camera would have to be positioned ~50,000 light years above or below the Milky Way’s center. The problem is immediately apparent. If it were possible to send a camera into space to the desired location at the speed of light it would take ~50,000 years to arrive there.
This requires astronomers and astro-physicists to content themselves with modeling the Milky Way based on what is observable. Figure 5, shown below is an example of the type of observation that we are able to make using spaced based telescopes, this image taken by the Spitzer infrared telescope launched into space in 2003 and remaining in orbit until 2016, sending back infrared images for 13 years. At the time, Spitzer was the culmination of NASA’s research employing infrared photography, the infrared spectrum revealing an incredible amount of information that had previously remained hidden. In NASA’s words, “Spitzer was the most sensitive infrared space observatory every launched”.
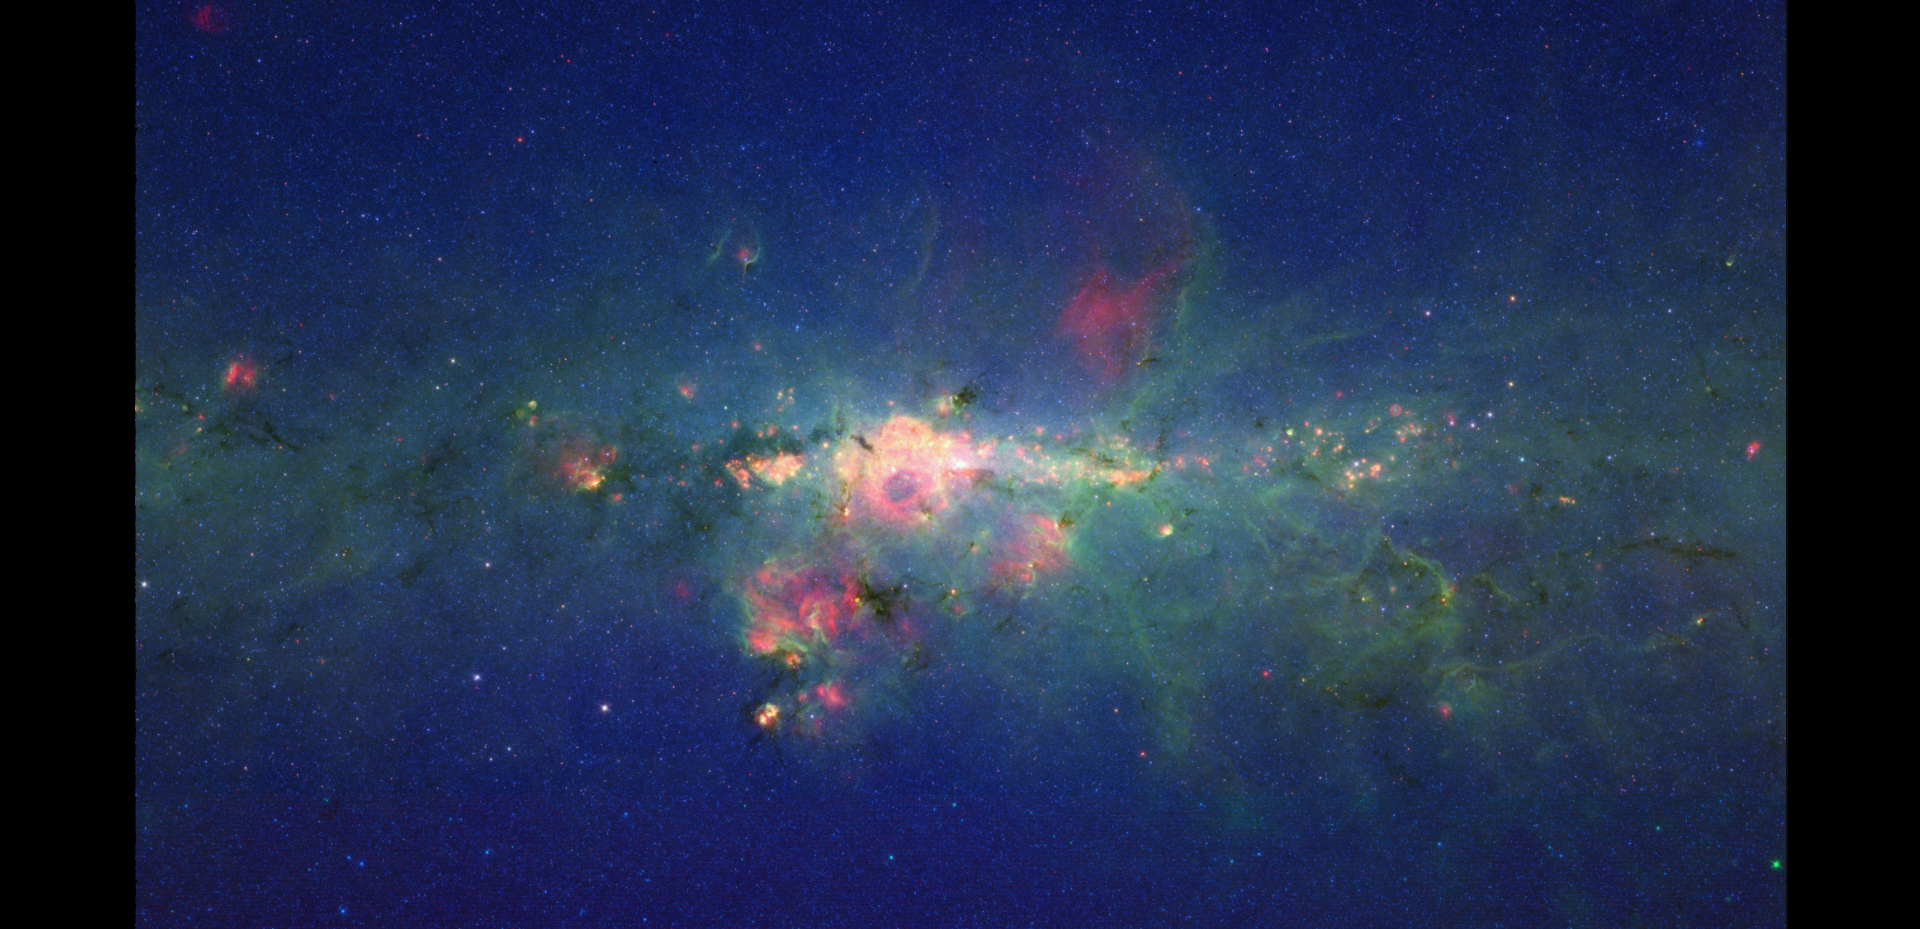
Here, Spitzer’s infrared camera is looking into the plane of the Milky Way at its center. Click on the graphic to view NASA’s article “Stars Gather In ‘Downtown’ Milky Way”.
Figure 6 below offers a 360 degree view of the plane of the Milky Way, the Spitzer camera capturing the image as it makes a complete circle. Click the image to view the video.
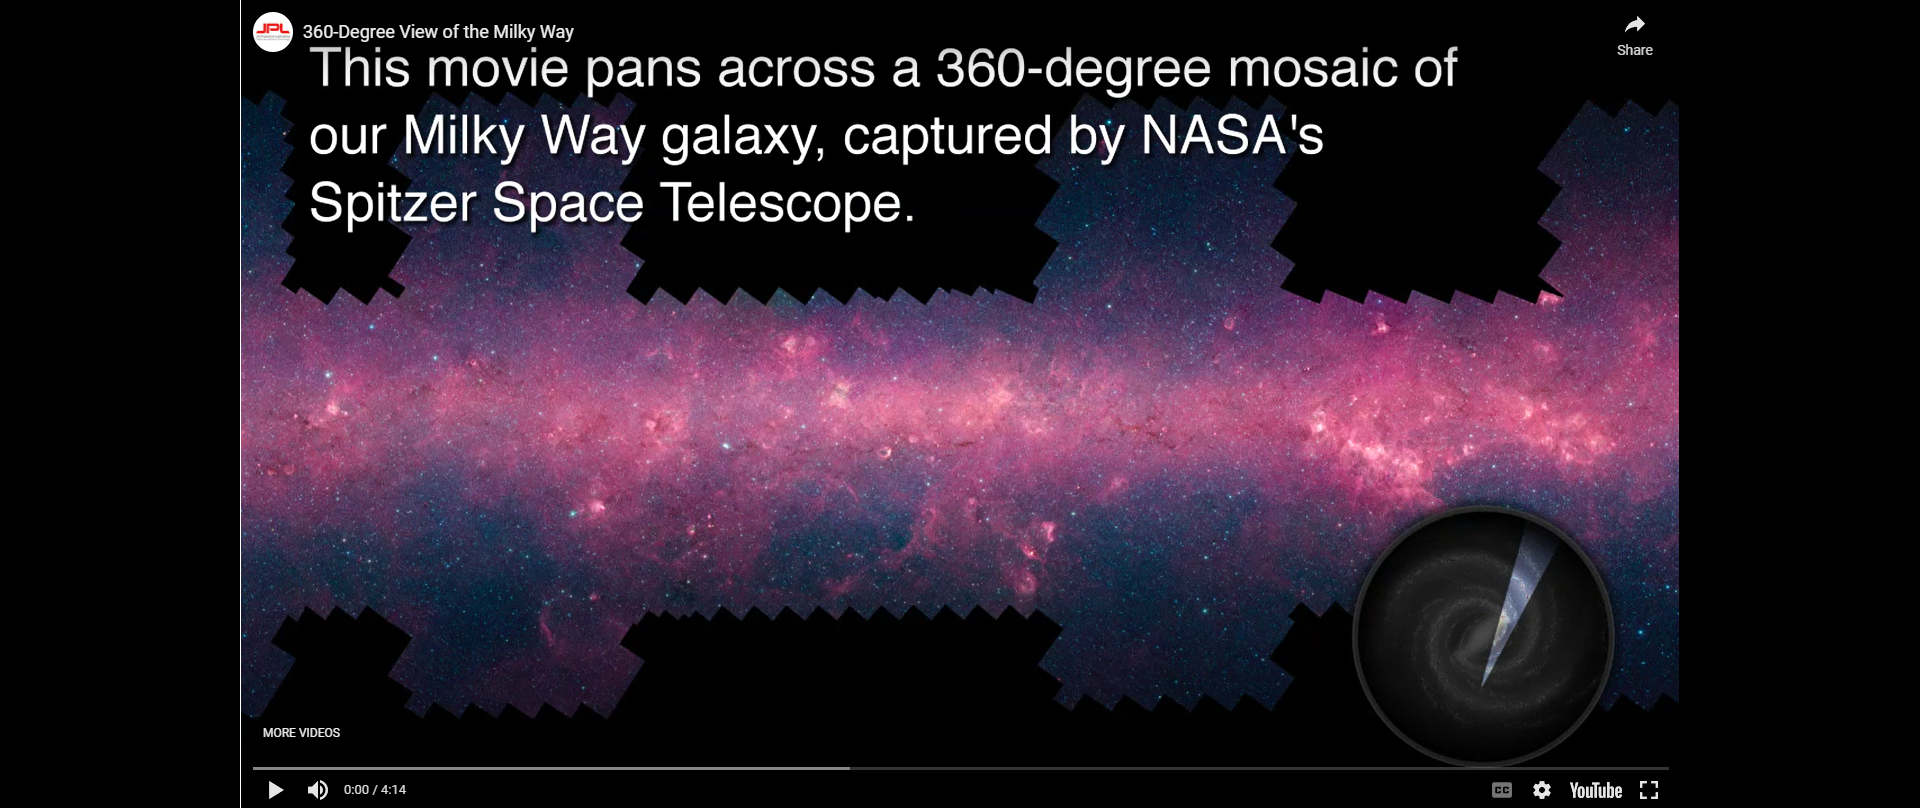
Figure 6: A Panoramic View Of The Milky Way Galaxy Taken By The Spitzer Infrared Telescope Launched In 2003.
While we are not able to view the Milky Way galaxy in which “our” solar system resides, we are able to view other galaxies that are far enough away from space cameras that we launch, galaxies that are as large as the Milky Way but that are oriented toward Earth more as a disc than a plane.
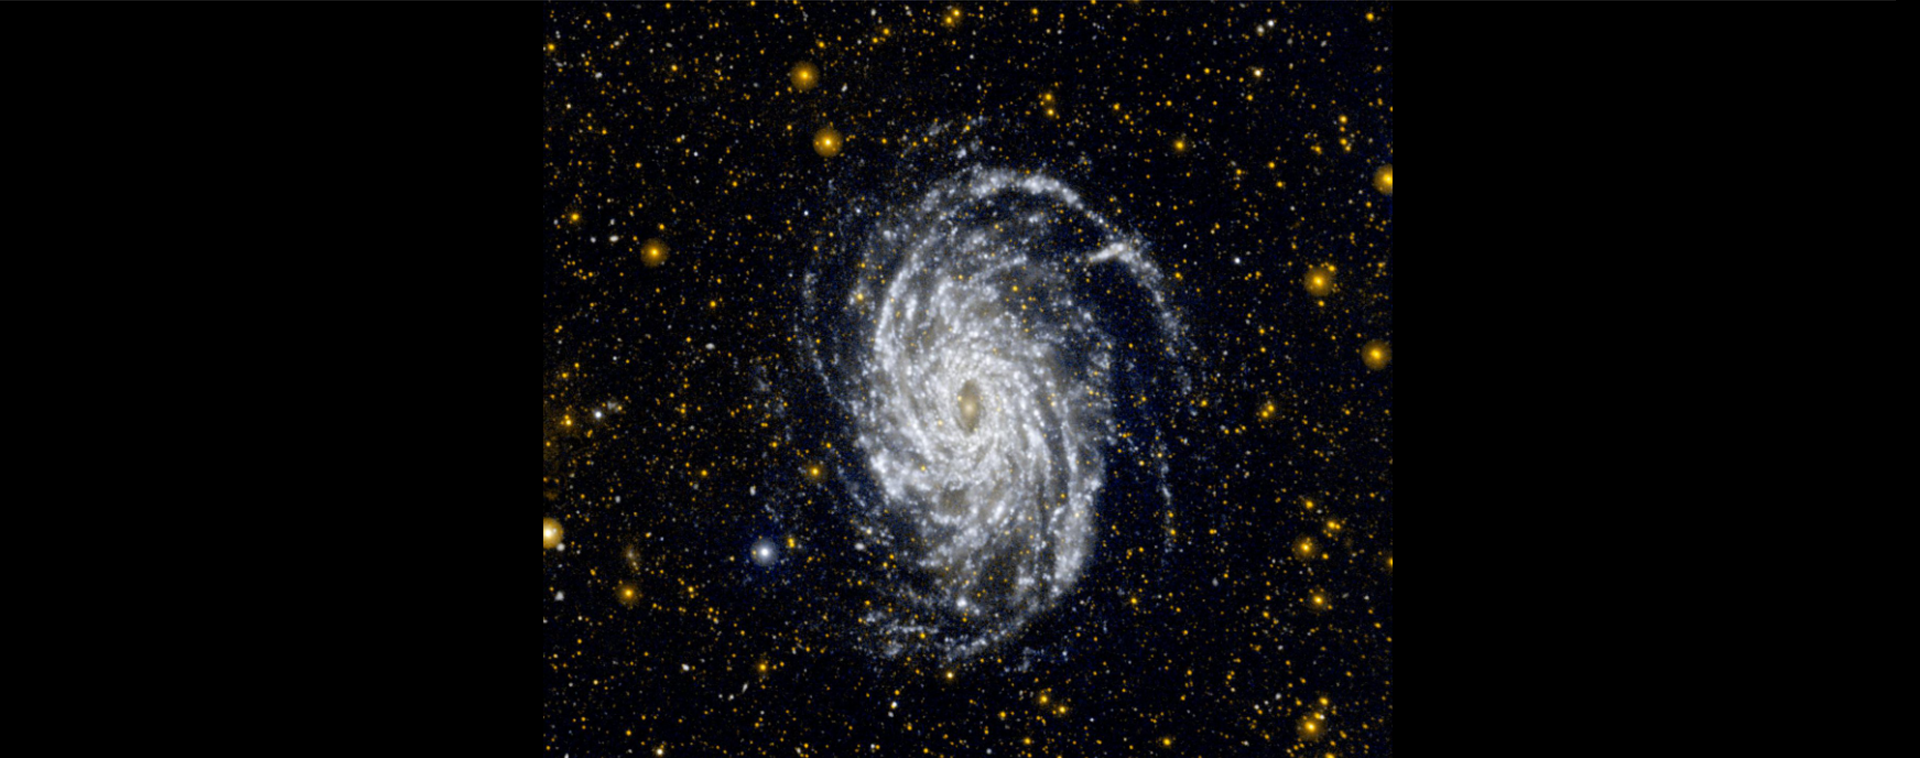
Figure 7: Galaxy NGC 6744, "One of the galaxies most similar to our own in the local universe."
Figure 7 above is a view of Galaxy NGC 6744, what NASA refers to as “One of the galaxies most similar to our own in the local universe”. This photograph was taken by “Galaxy Evolution Explorer”, a space telescope also launched in 2003, but this one optimized for ultraviolet vs. infrared photography. NGC 6744 is estimated to be 175,000 LY in diameter. It is situated in the constellation of Pavo at a distance of about 30 million light-years from Earth.
~
Returning to the matter of our daily travel…
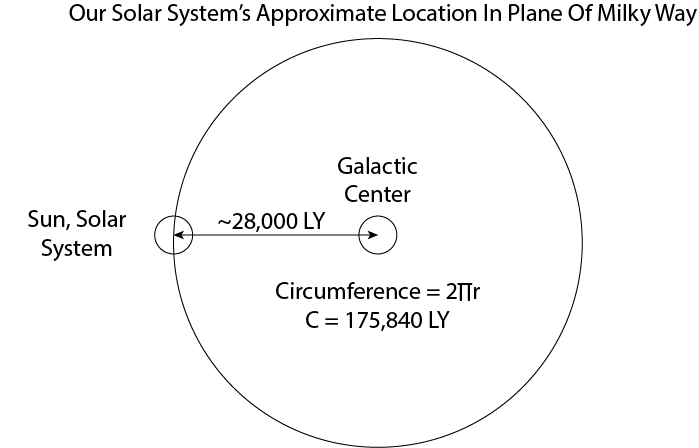
Figure 8: Our Solar System's Approximate Location In The Plane Of The Milky Way Galaxy
Our solar system is located ~28,000 light years from the galaxy center, yielding a galactic orbit of 176,000 light years. It is circling the center at an average velocity of 828,000 Km/Hr. (514,519 M/Hr.) yielding a rate of 8575 miles/second.
At the rate of 828,000 Km/Hour, in 24 hours we traverse the distance of ~20 million Km or ~12 million miles. Adding it up, to this point we’ve traveled 14,125,000 miles in a 24 hour period.
However, we have another major factor to consider, this being universal expansion, where the Milky Way and every other observable object is advancing outwardly toward infinity.
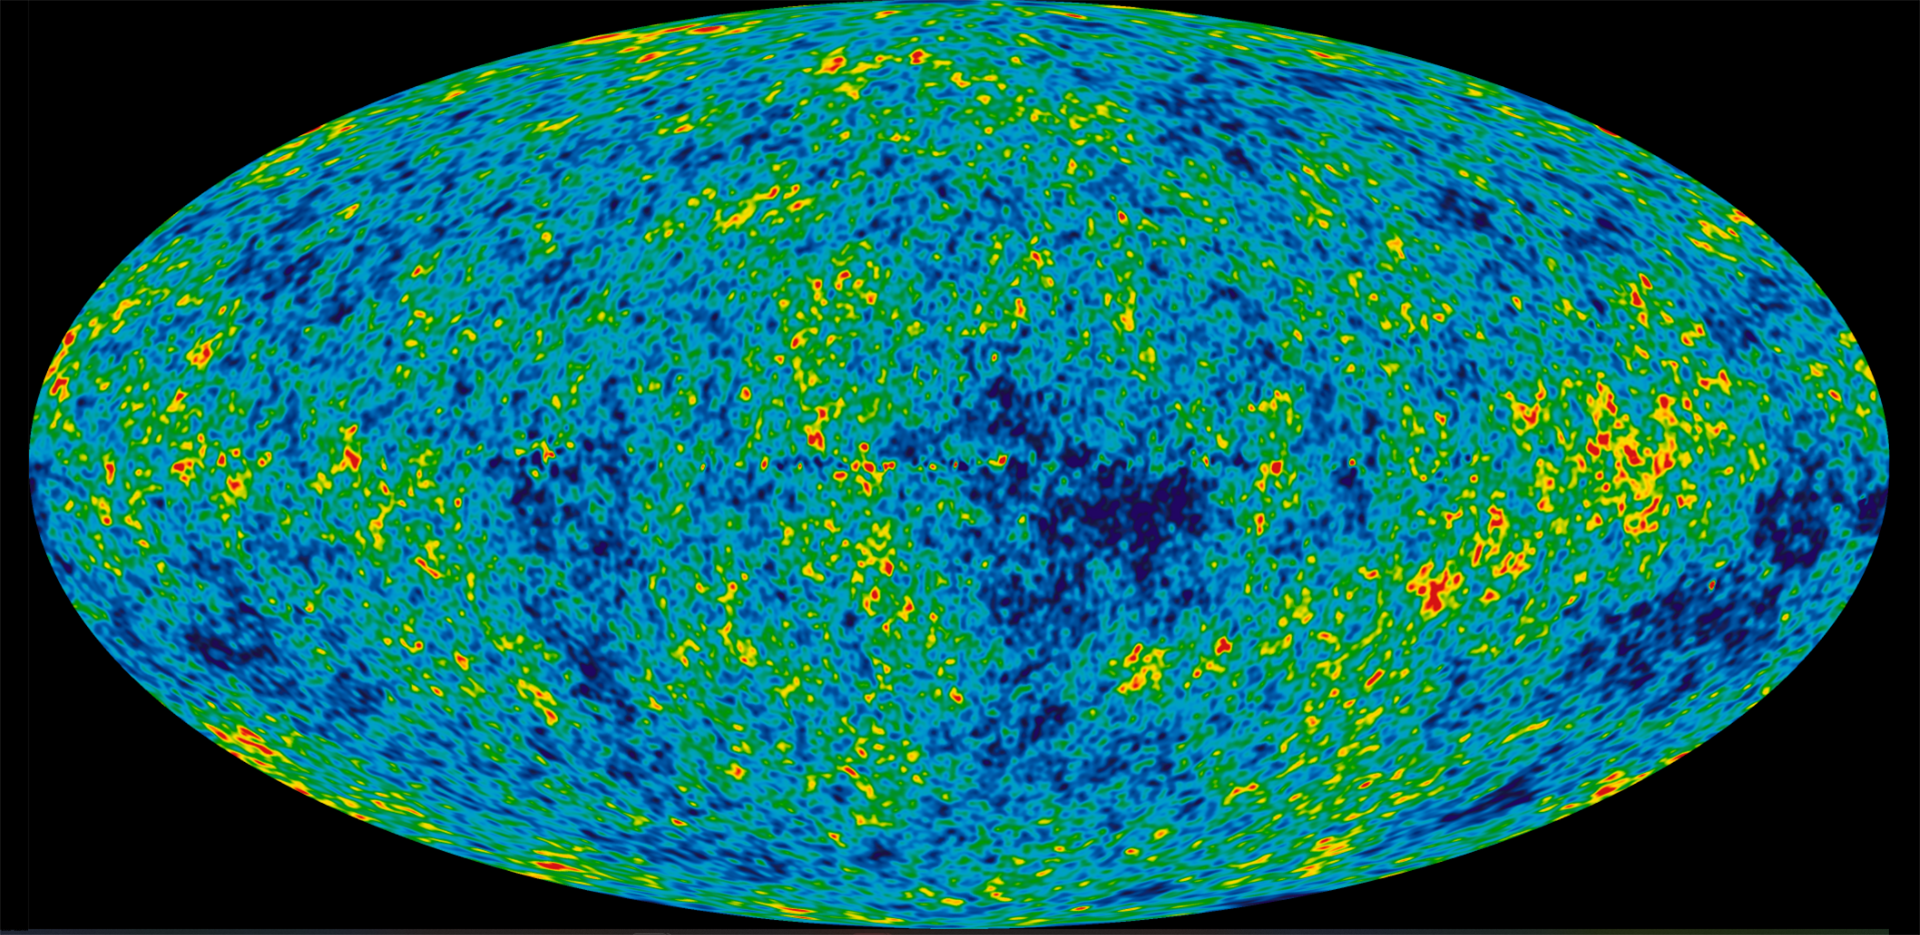
Figure 9: The Universe 380,000 Years After The Big Bang
The image of Figure 9 is a high resolution map of microwave light emitted 380,000 years after the Big Bang. The data was captured by the Wilkinson Microwave Anisotrophy Probe (WMAP) launched by NASA in 2001, remaining in orbit and active until 2010.
WMAP’s purpose was to measure and map the faintest of temperature differences that exist across the sphere of cosmic background as far out as we are capable of observing the edge of the universe. In other words, from a measurement point of view, we can think of the spherical object of Figure 9 as hollow, i.e., WMAP’s mission was to observe the very outer edge of what can presently be detected. Why?
The very outer edge is the earliest, relatively undifferentiated gaseous matter emanating from the Big Bang, the oldest detectable matter in the universe, estimated as of this modeling at 13.7 billion years old, this oldest undifferentiated matter still in a primordial gaseous form that emits a consistent signature, thereby making it detectable.
By analyzing this edge of Cosmic Microwave Background (CMB), scientists are able to confirm the age of the universe and the theory that all of the matter emanated from a single point, in that the edge is uniformly expanding outwardly at the rate of 70 km/S/Mpc ± 7 km/s/Mpc.(6)
One Mpc (Megaparsec) is 1 million parsecs. Per Figure 10, a “parsec” is the distance at which the hypotenuse and adjacent sides of a right triangle, with opposite side between Earth and the Sun, meet, forming an angle with 1 second of arc. The unit “arcsecond” is 1/3600th of a degree, .000277 degrees. This yields an adjacent side of 3.26 light years or 1 parsec.
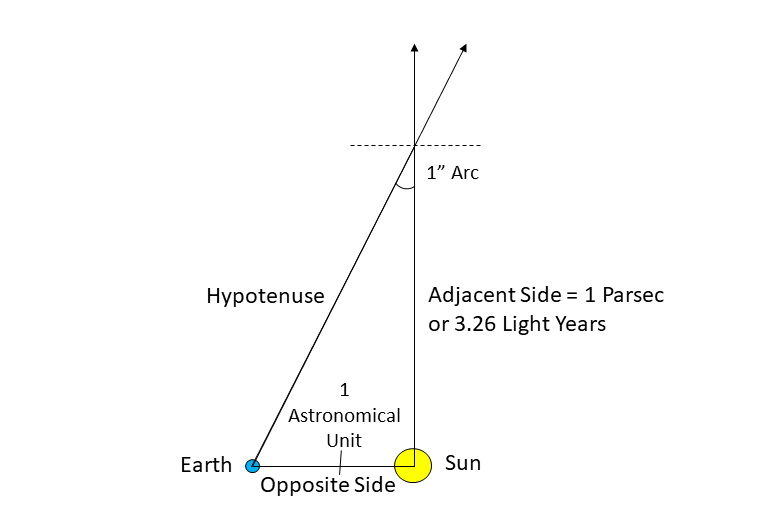
Figure 10: The Parsec
The distance between Earth and Sun is the fundamental constant that we have regarding our position in space. The Earth and Sun are 1 astronomical unit (AU) apart, 93,000,000 miles. Because these two points in space are known, we can use them to triangulate the the radial positions of other celestial objects, where the parsec is the standard unit of measure.
~
Not only is everything in the observable universe moving ever outward, it is also moving faster the further away that it is.
This discovery was preceded by the finding that the universe did not consist of the Milky Way galaxy alone, a belief that had been alive and well since the early days of astronomy, where it was believed that the Milky Way was the universe. One of the prevailing theories, circa 1920s was that the Milky Way was all that there is of the universe and that our Sun was at its center. This “Earth-centric” thinking dating back to the earliest astronomer/ philosophers, long before telescopes came into being.
The determination that the sky consisted of stars and galaxies beyond our own was asserted by Edwin Hubble, who in 1925 posited that the Andromeda galaxy was not part of the Milky Way, but was instead a galaxy of its own deeper in space. This hypothesis put the world of astronomy in turmoil for decades thereafter, astronomers and astrophysicists having to recalibrate their Milky Way centric paradigm to accept that the universe is in fact much much larger than the Milky Way alone. (Today, there are hypotheses that the universe could very well be trillions of light years across.)
This began the race to determine just how large the universe really is, and to do this, the rate at which things were moving away from each other had to come into play. Circa 1929 Hubble estimated this rate by observing and correlating data from his observations of 26 extra-galactic objects (outside of the Milky Way), assessing their distance from Earth and from each other, and by analyzing their red shifts.
Red shift refers to a shift in the frequency of electromagnetic emission of an object as a consequence of its movement away from or toward the observer, i.e. a slowing down if the object is moving away and its wavelength stretching ever longer, or a speeding up if the object is moving toward the observer, its wavelength growing ever shorter.
An interesting aside…
The term “red shift” originated relative to visible light, i.e. optical telescopy, the electromagnetic spectrum consisting of frequencies between zero and infinity, visible light occupying the small portion of the spectrum between 380 and 700 nanometers, corresponding to 380 TeraHertz (red end of spectrum) and 700 TeraHertz (violet end of spectrum), respectively. 1 THz is equal to 1000 GigaHertz (GHz.)
We are all familiar with these “colors of the rainbow”, the water droplets in the atmosphere acting as prisms when the light hits them at just the right angle. Figure 11 below, is a picture of the spectrum being cast by a triangular prism standing at an angle in a water glass at noon. The rainbow is projected on to a sheet of white paper. Here is a great reference as to how a prism causes white light to separate into a rainbow.

Figure 11: The Spectrum Of Visible Light As Separated By A Prism
Red shift refers to a shift in the frequency of light toward the red end of the visible light spectrum, i.e. a slowing down of frequency as a consequence of the object moving away from the observer. Referring to a prism, an object that is moving toward the observer would present a shift toward the violet end of the spectrum, i.e. its frequency growing higher and its wavelength shorter. An object moving away presents the opposite spectral shift, the frequency of its light growing slower and its wavelength longer. Without this fundamental physical behavior of objects in motion, and this electromagnetic effect, modern day astronomical measurement of motion toward or away from us would not be possible. This is the same fundamental physical phenomenon as the “Doppler Effect”, which is commonly used in reference to sound, but also for all matter of tracking, i.e. sonar, radar, and astronomy, where astronomy initially employed visible light but now employs the entire electromagnetic spectrum, where one of the fundamental parameters being assessed is motion.
Returning to Hubble, he examined the spectral shift of extra-galactic objects as a consequence of their outwardly bound movement, using their red shifts as a measure of their respective velocities. In so doing, he found there to be a linear relationship between their red shifts and their radial (outwardly bound) velocities, this correlation coming to be known as Hubble’s Law, now corrected as the Hubble-Lemaître Law, to include his Belgian contemporary Georges Lemaître, who put forward the theory that the outward movement of galaxies was a consequence of an expanding universe a couple of years before publication of Hubble’s theory correlating radial velocity and red shift. What part Lemaître’s hypothesis played in Hubble’s research remains unclear to this day, but Lemaître did document his theory in writing before Hubble announced his own findings regarding velocity and red shift, i.e. before completion of his work determining that the universe was indeed expanding.
Another determination by Hubble was that the further away objects are, the faster they are moving. Hence, the outward movement of ~70km/S per Mpc. This ever outward movement with speed ever increasing has given rise to the concept of “A Great Attractor”, something that is drawing everything in the universe outwardly at an ever accelerating rate. Some have theorized that it is “dark energy” that exists beyond our ability to see or detect, beyond the bounds of the “visible” universe depicted by the radiograph of Figure 9.
Today’s astronomical understanding of the cosmos includes the very interesting facts that: a) everything originated from a single point in space, b) everything that originated is moving ever outwardly at an accelerating pace, c) black holes are a reality, where a black hole is a single point in space with a gravitational field so strong that it consumes any celestial object that happens to come within its grasp. In the last 5 years 2 black holes have been confirmed to exist at the centers of 2 galaxies, including our own Milky Way. This presents the very intriguing question: Is there a black hole at the center of all galaxies? Is the presence of the black hole the powerful force around which a galaxies form and exist?
~
To conclude, we have these primary motions, all in play simultaneously, rotating, orbiting, and expanding, all on a continuous basis:
1) the daily rotation of planet Earth: 25 thousand miles/day
2) the annual rotation of the Earth around the Sun: 1.6M miles/day
3) the rotation of the solar system around the center of the Milky Way, i.e. the rate that the Milky Way is rotating: 12.5M miles/day
4) the ride that we take on the Milky Way in the ever expanding universe: 3.75M miles/day.
The total being: 17.875 million miles per day.
For context, the moon is 239,000 miles away from Earth
~
A final note…
In the last few years, two major announcements have been made regarding the accurate radiological capture of black hole images. This was made possible by The Event Horizon Telescope. The first was the black hole located in the center of galaxy M87 in 2019.
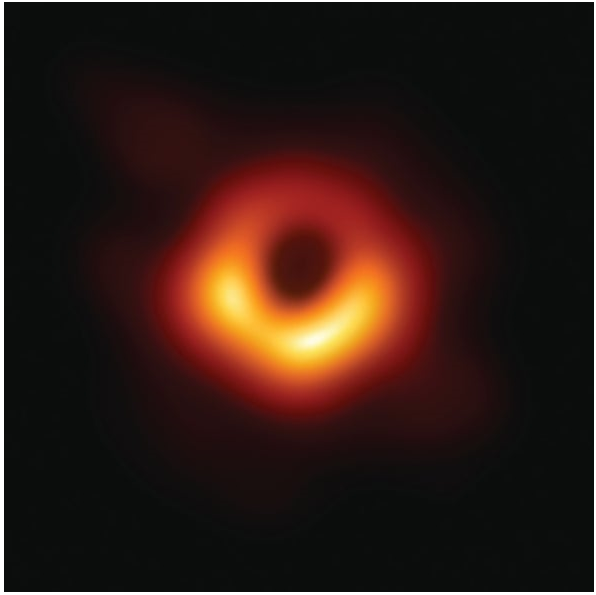
Figure 12: The Black Hole At The Center Of Galaxy Messier 87 Taken By
The Event Horizon Telescope, 2019.
The second was the black hole located at the center of our own Milky Way galaxy in April, 2022.
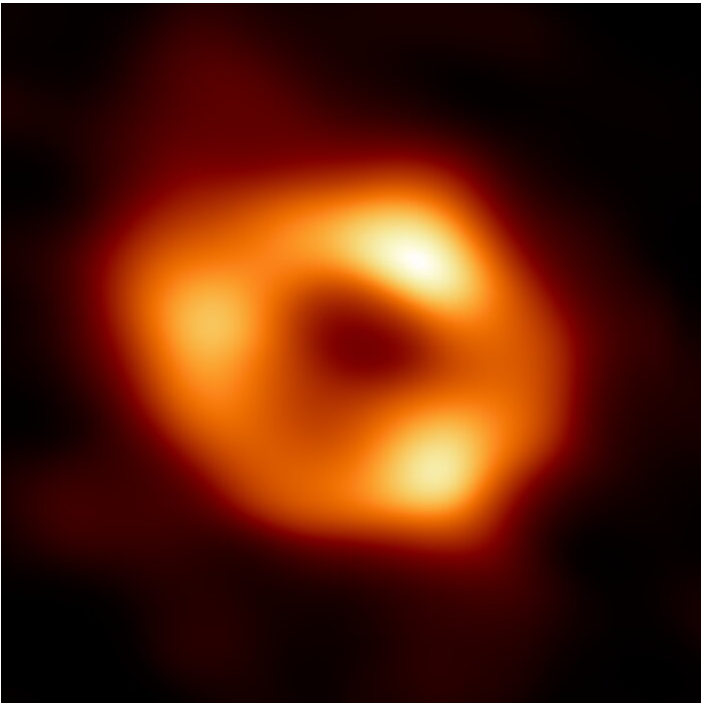
Figure 13: The Black Hole At The Center Of The Milky Way Galaxy Taken
By The Event Horizon Telescope, 2022
Both announcements were major celebrations for the science of astronomy and astrophysics because they are considered the first highly accurate captures of the true images of black holes.
Both images were years in the making, here referring to the long periods of preparation, observation, and analysis of the recorded data. 2019 and 2022 where the dates when the results were formally announced to the world, along with the images.
Both were “captured” by The Event Horizon Telescope, a global network of large radio telescopes that work in unison to capture and process an extremely broad spectrum of electromagnetic emissions.
They represent the first such images that confirm the theory that black holes should exist ― as put forward by Albert Einstein in his General Theory Of Relativity.
The End
References:
1) Tracing the Arms of our Milky Way Galaxy (nasa.gov)
2) 360-Degree View of the Milky Way (nasa.gov)
3) X-Shaped Bulge in the Milky Way (nasa.gov)
4) Global Images of Earth (nasa.gov)
5) Cosmic Times, 2006, Seeds Of The Modern Universe
6) Imagine the Universe! (nasa.gov), Hubble Constant
7) Light In The Darkness, Heino Falcke
8) The Event Horizon Telescope
9) Navigation Devices of Ancient Mariners – Online Star Register (osr.org)
10) ABC Zoom – Refraction: Why glass prisms bend and separate light